Movip
Process Risks
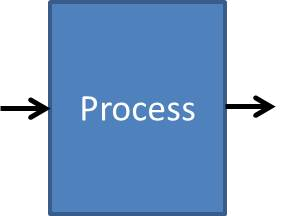
Process
Process Risk
To calculate the Zero Hour Defect Rate (ZHDR) of a process the following formula can be used where the Defect Opportunities (DO) represent the process risks, which can be more than 1, and the Deffects Per Million Opportunities (DPMO) the risk in Parts Per Million (ppm) per Defect Opportunity (DO).

Example: An process has two identified risks. Risk 1: 200000 ppm and Risk 2: 400000 ppm. The end result of this process will be that the process Zero Hour Defecrt Rate (ZHDR) is 0.52. (this means that out of the 100 parts leaving the process 52 not meats the output requirement of this process.) Precondition is that the two risks are independent of each other. There are 3 options to Mitigate those risks entering the next process.
- Change the Design
- Improve the Process
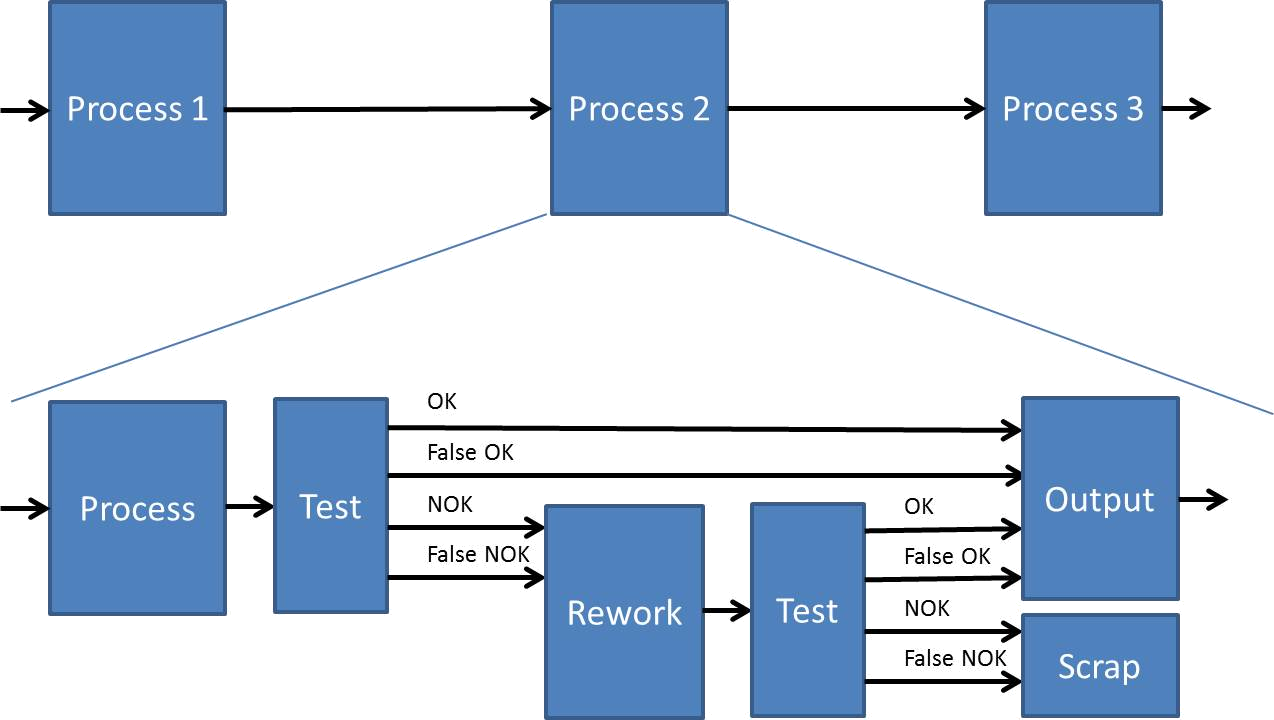
- Test
Test
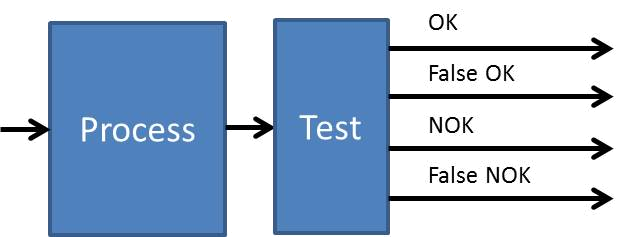
- OK
- False OK
- NOK
- False NOK
Each applied test is not perfect in finding the process risks. This means that a risk is slipped through the test.
OK
OK means that the test has found no risks and the process output is meeting the requirements.
False OK
With a false OK the test is not detecting all risks and gives an OK. The test has not the 100% coverage needed to identify good systems. These false OK's can result in a defect later on in the following processes or a life time issue later on. The measure of false OK's is determined by the Slip of the test.
NOK
With a NOK the test found a Risks which resulted in a NOK.
For this the variable Slip is a measure of how much the risk is mitigated.
If the slip is 1 no mitigation takes place.
If the slip is 0 the risk is completely mitigated.
![]()
The not mitigated (detected) risk will result in a False OK.
False NOK
With a False NOK the test found a Risks which was not there. The process delivered an OK output but was given a NOK. A possibility is that the test has parameters which have a to tight window which results in a False NOK. This is unnecessary loss.
Zero Hour Defect Rate (ZHDR) calculation
To calculate the Zero Hour Defect rate (ZHDR) the Test slip has to taken into account where a Slip of 1 means no risk detected and a 0 all risk detected. An in between value means a incomplete risk detection.

Example: same 2 risks but with an applied test of Slip 1: 0.2 and Slip 2: 0.1. The Zero Hour Defect Rate (ZHDR) will be now dramatically reduced to an 0.0784. (This means that out of the 100 parts leaving the process only 7.84 parts not meets the requirements.)
The process output is:
- OK = 50.4%
- False Ok = 3.336%
- NOK = 46.24% (16% test/slip 1 & 30.24% test/slip 2)
- False NOK = 0%
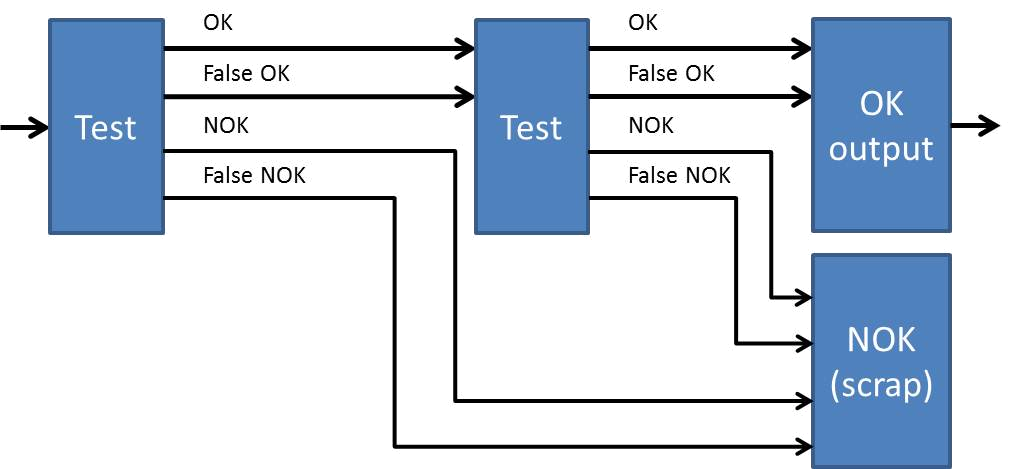
Rework
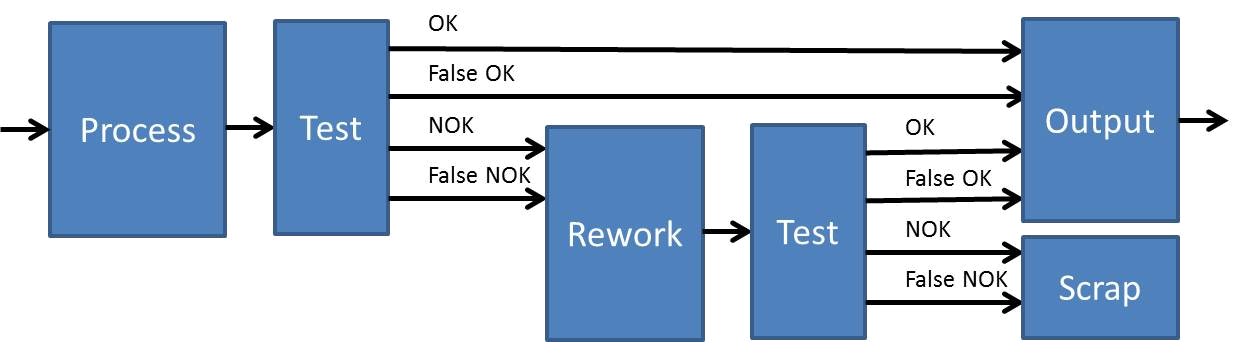
Total Process
Test Efficiency
![]()
Example: 100 parts are entering the process of which 80 are OK and 20 * Slip (0.2) are false Ok and 20 * (1-Slip) are NOK. This results in:
- OK = 80(%)
- False OK = 4(%)
- NOK = 16(%)
With more than 1 parameter to test the test will change in a OK and a NOK flow.